Introduction
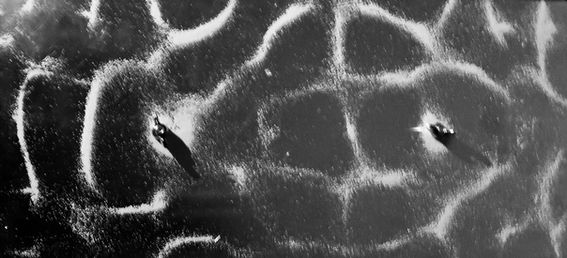
Chladni plates are constructed using a thin metal plate mounted onto a speaker. The plate is covered in a thin layer of sand that forms patterns, or chladni figures, when certain frequencies are played through the speaker. The patterns produced are the result of standing waves. The spots where the sand stands still are the nodes of the standing waves, or points of no motion. In the empty spaces, the sand is vibrating very quickly; these spots are the antinodes, or points on the standing waves where there is lots of motion happening. The higher the frequency played, the more intricate the pattern, because the nodes are closer together on the standing wave.
Methodology
For This experiment, I started by experimenting with various speakers. I used some old TV speakers that I had in my garage. First I broke off the top part of the speaker and un-screwed the two mid-tone speakers from the box. I connected the speakers to my computer and to the receiver we had kept with the speakers. I then collected the rest of the materials. These materials included: a metal plate, bolts, washers, wingnuts, foam, foil cupcake pan, hot glue, sand, and online tone generator. I used a spray foam and the foil cupcake pan as the mold. I had to spray water on the foam so it would cure; this took about 4 hours, including drying time. The next step was to construct the chladni plate. My neighbor helped me out by cutting the metal and drilling holes in the middle of the plates so that I could mount them onto the foam on top of the speaker. To build the chladni plate, I first trimmed the foam down to size and shaped it into a spherical shape with a serrated knife. I poked a hole in the top of both foam pieces and hot glued the bolts into them. I then glued the washers on top of the bolts. I hot glued the foam spheres onto the speakers and secured the plate onto the bolt by screwing the wingnut on top. I then sprinkled sand on top of the plate and started the experiment.
.jpg)


Results
I tested 20 different frequencies. Table 1 shows the different frequencies and the volume setting utilized. The more intricate patterns were seen with higher frequencies. The highest frequency reached that still produced a pattern was 1,565 Hz. Low frequencies had simple patterns. The lowest frequency reached that produced a pattern was 166Hz. Volume played a role in obtaining a visible pattern. The sound volume had to be reduced for low frequencies. The lowest sound volume used was 42 decibels. Higher frequencies required higher sound volume. The highest sound volume used was 74 decibels. The average frequency was
706 Hz and the average sound volume was 65. Figure 1, is a graph of the frequency and the corresponding sound volume used.
Table 1

Figure 1

Click on the images below to see which frequency they were taken at
Discussion
Although the experiments were accomplished, there were several barriers encountered. One barrier was limited knowledge on speakers, wiring, and connecting speakers to the receiver and to my computer in order to generate sound. The majority of the barriers were due Covid-19 limitations such as at-home orders, store closures, limited product availability, busy stores limiting pick up of purchased items, and delays in shipping by most online stores including Amazon. I was able to find most of the materials at Lowe’s and at home. Once the chladni plate was constructed and all components were connected, obtaining visual patterns included identifying the correct frequency and the best sound volume. The higher the sound, the more vibration was generated. Too high of a sound for the frequency used would disrupt the pattern that had been created. Too low of a sound for the frequency used would not create the necessary vibration and no visual pattern would be created. Once the ideal frequency and corresponding sounds were identified, visual patterns were captured using still photography. A video of the visual pattern changes created with changes in frequency was captured to help the viewer see the transition between chladni figures.


